
Products / AIOps Data Center
Product · AIOps Data Center
See your infrastructure. Understand what matters.
AIOps Data Center gives operations teams one view of assets, dependencies, alarms, performance and AI-assisted decisions across every data center, from the rack to the application.
Data center → Room → Row → Rack → Server → VM
How it works
From raw network data to decisions
Each stage builds on the one before it, so every alarm, KPI and AI finding is tied back to a trusted inventory record.
Discover
- ICMP, SNMP, SSH and LLDP discovery
- Classification with a confidence score
- Rack placement from evidence
Reconcile
- Match against existing inventory
- Conflicts flagged for review
- Approve or reject into inventory
Analyze
- Alarms and KPIs on every layer
- Anomaly detection and correlation
- Root cause with evidence
Act
- Recommended actions
- Capacity forecasts
- Reports for operations and leadership
Product film · 70 seconds
Auto Discovery in action
Unknown assets, wrong racks and surprise outages start with an inventory nobody trusts. See how Auto Discovery finds infrastructure, explains each match and holds conflicts for review.
Platform modules
9 modules, one data model
Select a module to see it. Click any screen to view it full size.
The whole estate at a glance
Command Center
A single starting point that shows managed resources, active alarms, utilization and AI status across every site, with direct entry into each workspace.
- Live counts for sites, racks, servers and VMs
- Latest signals that need attention
- Status of the AI engine and active detections
Every asset with full context
Inventory
Physical, virtual, network, Kubernetes and application assets in one database-backed inventory, organized by data center, room, row and rack.
- Servers, storage, network devices, VMs and Kubernetes
- Health coverage across all scored resources
- Search by hostname, IP, model or location, and export
Discover, classify, reconcile
Auto Discovery
Discovery finds infrastructure, classifies it and matches it to existing inventory. Every decision comes with a confidence score and a plain-language explanation.
- Multi-protocol, read-only discovery per data center
- Conflicts such as serial mismatches held for review
- Rack placement confirmed by LLDP or switch-port evidence
Trace every dependency
Topology
Physical, logical, service and end-to-end views of how the estate connects, from WAN edge and core routers down to racks and servers.
- Five views: physical, logical, service, expanded, end-to-end
- Graph and table modes
- Filter by site, network type, rack, VLAN and health
From business service to container
Service Dependency
Map business services to the applications, Kubernetes services, workloads and pods that run them, so the impact of a fault is clear.
- Drill down from service to pod
- Health derived from stored runtime status
- Hosting and scheduling relationships shown
Utilization at every level
KPI Dashboard
Infrastructure performance from data-center level down to individual servers and VMs, refreshed continuously from the time-series store.
- CPU, memory, storage, network and environment views
- Scope by data center, rack, server or VM
- Threshold states shown on every gauge
Prioritize and resolve
Alarm Console
Monitor and investigate alarms at every infrastructure and service level, with correlated incidents grouped so teams work the cause rather than each symptom.
- Location and resource hierarchy filters
- Correlated incidents alongside raw alarms
- Acknowledgement and resolution lifecycle
Detect, correlate, diagnose, predict
AI/ML Insights
Four connected capabilities that turn unusual behavior into explainable operational insight, each with its own workspace.
- Anomaly detection on metrics and feature deviations
- Event correlation into incidents
- Root-cause findings with evidence, impact and action
Reports from trusted data
Reports
Executive, operational and capacity reports built from the same inventory and telemetry as the live workspaces, each with its own filters and exports.
- AI/ML, KPI, Kubernetes, network and inventory reports
- Rack power, cooling and space report
- Filter, formula and schedule options
Also included
Executive Dashboard
Overall health, services, utilization, incidents, MTTR and power on one screen for leadership.
AIOps Expert
Ask operational questions in plain language and get answers grounded in live inventory, alarms and topology.
Usage Report
See how teams use the platform across workspaces.
Screens are from the ARDMATRIX demonstration environment with sample data.
Security and deployment
Built for operator and enterprise governance
Read-only discovery
Discovery collects evidence without changing device configuration.
Human approval
New and conflicting assets are reviewed and approved before they enter inventory.
Explainable decisions
Every match, rack placement and AI finding shows its confidence and the evidence behind it.
Secure sessions
Encrypted sessions with automatic expiry and monitored access.
Management-plane data only
The platform works with telemetry, inventory and alarm data, not application payloads.
Your infrastructure
Deployed in your data center or private cloud, close to the systems it observes.
Built from operations experience
Designed by people who have run these networks.
ARDMATRIX is led by Dheeraj Mehrotra, with more than 25 years in telecom operations across Core and RAN optimization, OSS, international roaming, managed services and AIOps for fault and performance management. The platform reflects how operations teams actually work: inventory first, evidence for every decision, and AI that explains itself.
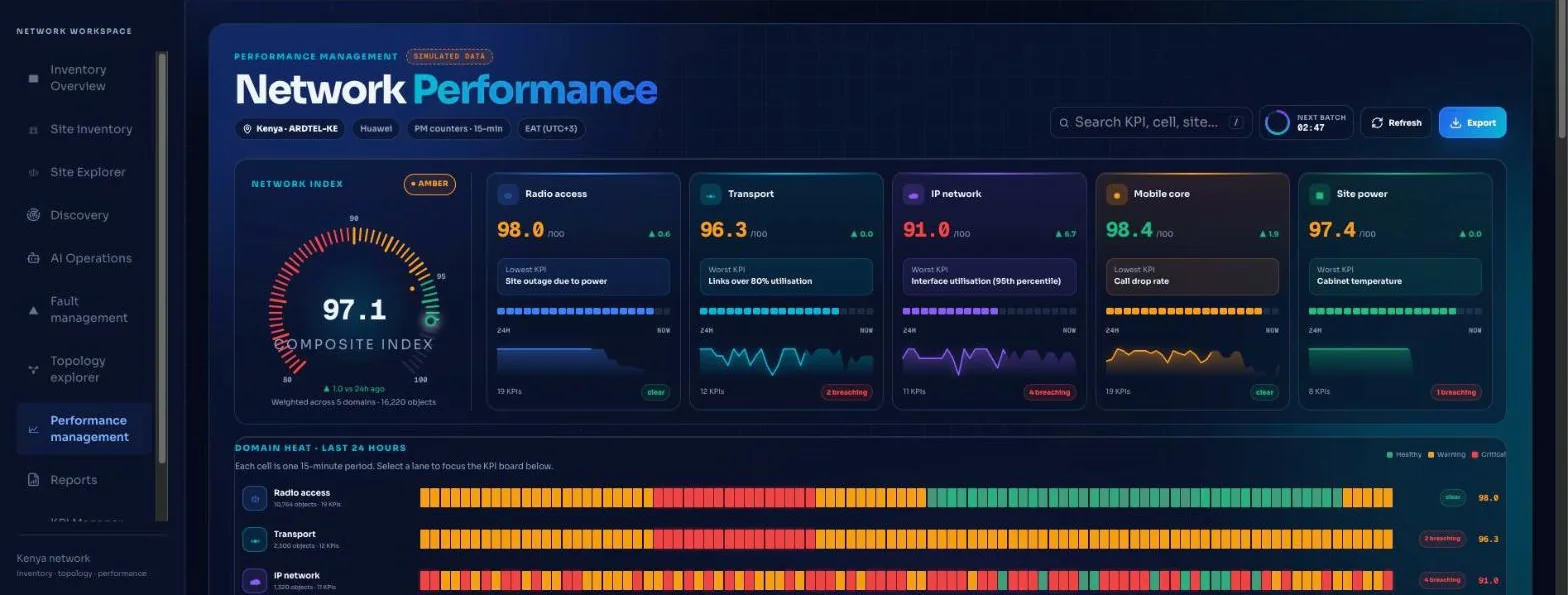
Also from ARDMATRIX
ARDMATRIX AIOps — Telecom
AIOps Telecom brings inventory, discovery, faults, performance and topology into one governed workspace, so NOC, planning and field teams work from the same trusted record of the network.
View AIOps Telecom →Services
Integration and managed operations
Our team connects the platform to your OSS, element managers and data sources, and can run it with you as a managed service.
View services →Next step
See it on a scope of your own network.
We run a guided technical walkthrough with your team, then agree a time-boxed pilot on a defined slice of management-plane data.
Or write to sales@ardmatrix.com