
Products / AIOps Telecom
Product · AIOps Telecom
One operational view of the mobile network, from core to cell.
AIOps Telecom brings inventory, discovery, faults, performance and topology into one governed workspace, so NOC, planning and field teams work from the same trusted record of the network.
Network → Region → City → Cluster → Site → Cell
How it works
From raw network data to decisions
Each stage builds on the one before it, so every alarm, KPI and AI finding is tied back to a trusted inventory record.
Collect
- OSS northbound interfaces
- Element manager alarm feeds
- PM counter files
- Physical asset registry
Reconcile
- Discovery against authoritative inventory
- Changed, new and missing objects
- Human review before changes land
Correlate
- Alarms mapped to sites and equipment
- Topology and end-to-end paths
- Domain and KPI health scoring
Operate
- NOC dashboards and alarm lifecycle
- Governed reports for every audience
- Plain-language AI assistant
Platform modules
10 modules, one data model
Select a module to see it. Click any screen to view it full size.
Every network element in one place
Network Inventory
A single inventory of every element in operation: where it is, what it is and its recorded state. Teams can open any domain and inspect equipment down to chassis, slots, cards, ports and optics.
- Hierarchy from network and region down to site and cell
- Five domains with object counts and health
- Search by site, device, IP address or serial number
The network footprint on a map
Site Inventory
Browse every site on a live map or as a table. Sites roll up into regions, cities and clusters, and the map shows fault state at each level.
- Filter by region, city, cluster, technology, vendor and health
- Switch between aggregated geography and individual sites
- Export the filtered list to CSV
A complete record for each site
Site Explorer
Site 360 gives engineers one record per site: location, environment, equipment, radios, cells, services, ports and transmission links, with open alarms shown beside them.
- Equipment, radio and CPRI, ports and SFP views
- Trace the transmission path from site to core
- Audit history for every change on the site
Inventory you can trust
Discovery & Reconciliation
Discovery compares what the network reports with the authoritative inventory. Configuration and identity differences go to a review queue; live operational state is recorded for information only.
- Scheduled connectors for OSS, core and transport sources
- Changed, new, missing and matched objects per run
- Approval workflow before inventory is updated
Alarms with network context
Fault Management
The alarm lifecycle from the element manager, mapped to authoritative inventory, so every alarm shows which site, equipment and domain it affects.
- Live alarm stream with severity and lifecycle filters
- Mean time to acknowledge and resolve, by severity
- Alarm breakdown by domain: RAN, Core, IP and Transport
See how the network connects
Topology Explorer
An interactive map of radio sites, IP and transport links and core elements. Engineers can zoom from the whole country down to a single node and its neighbours.
- Geographic, hierarchy and organic layouts
- End-to-end path from any element
- Failure simulation to see the impact before it happens
Network health in one index
Performance Management
PM counters scored into a composite network index and a score for each domain, with the weakest KPI in each domain shown first.
- Composite index across radio, transport, IP, core and site power
- 24-hour domain heat map in 15-minute periods
- Breaching KPIs flagged per domain
KPIs governed like code
KPI Manager
Manage the KPI catalogue, formulas, thresholds and presentation. Every edit creates a new formula version, so historical values stay traceable.
- Standard and custom KPI definitions
- Formula version history
- Validated bulk import of counters and KPIs from CSV
Governed reports for every audience
Reports
Operational reports built on the same inventory, alarm and performance data as the live workspaces, scoped by tenant and domain on the server.
- Alarm summary, KPI performance and discovery reports
- Inventory, asset register and topology path analysis
- Export to CSV, Excel and PDF
Ask the network in plain language
AI Operations
An operations assistant that answers questions from live inventory, alarm and site data. It runs on a local model, so network data is not sent to an external AI service.
- Grounded in governed platform tools
- Read-only, with user access rules enforced
- Inventory summaries, alarm summaries and site lookups
Also included
Administration
Access control by tenant, role, domain, geography, technology and assigned resources.
Corporate sign-in
Users sign in through the organization's own directory.
Alarm notifications
In-app notifications for new alarm activity across permitted domains.
Screens are from the ARDMATRIX demonstration environment with sample data.
Security and deployment
Built for operator and enterprise governance
Scoped access
Every user sees only their permitted tenant, domains, geographies, technologies and resources. Reports apply the same rules on the server.
Management-plane data only
The platform works with OSS, alarm, inventory and performance data. It does not need subscriber or user-plane traffic.
Local AI
The AI assistant runs on a model hosted with the platform. Questions and answers stay inside your environment.
Read-only by default
AI and discovery read the network. Changes to inventory go through review and approval.
Traceable KPIs
KPI formulas are versioned, so any historical value can be traced to the definition that produced it.
Your infrastructure
Deployed in your data center or private cloud, close to your OSS and element managers.
Built from operations experience
Designed by people who have run these networks.
ARDMATRIX is led by Dheeraj Mehrotra, with more than 25 years in telecom operations across Core and RAN optimization, OSS, international roaming, managed services and AIOps for fault and performance management. The platform reflects how operations teams actually work: inventory first, evidence for every decision, and AI that explains itself.
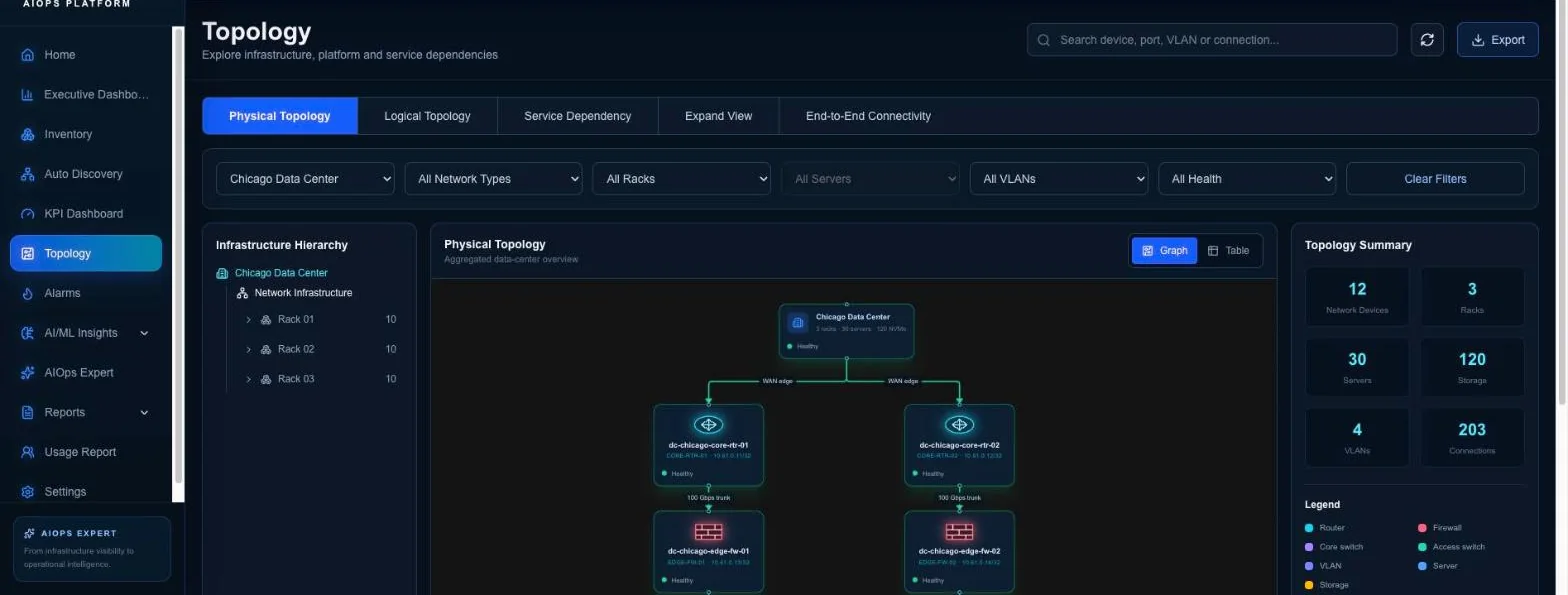
Also from ARDMATRIX
ARDMATRIX AIOps — Data Center
AIOps Data Center gives operations teams one view of assets, dependencies, alarms, performance and AI-assisted decisions across every data center, from the rack to the application.
View AIOps Data Center →Services
Integration and managed operations
Our team connects the platform to your OSS, element managers and data sources, and can run it with you as a managed service.
View services →Next step
See it on a scope of your own network.
We run a guided technical walkthrough with your team, then agree a time-boxed pilot on a defined slice of management-plane data.
Or write to sales@ardmatrix.com